Download to read offline
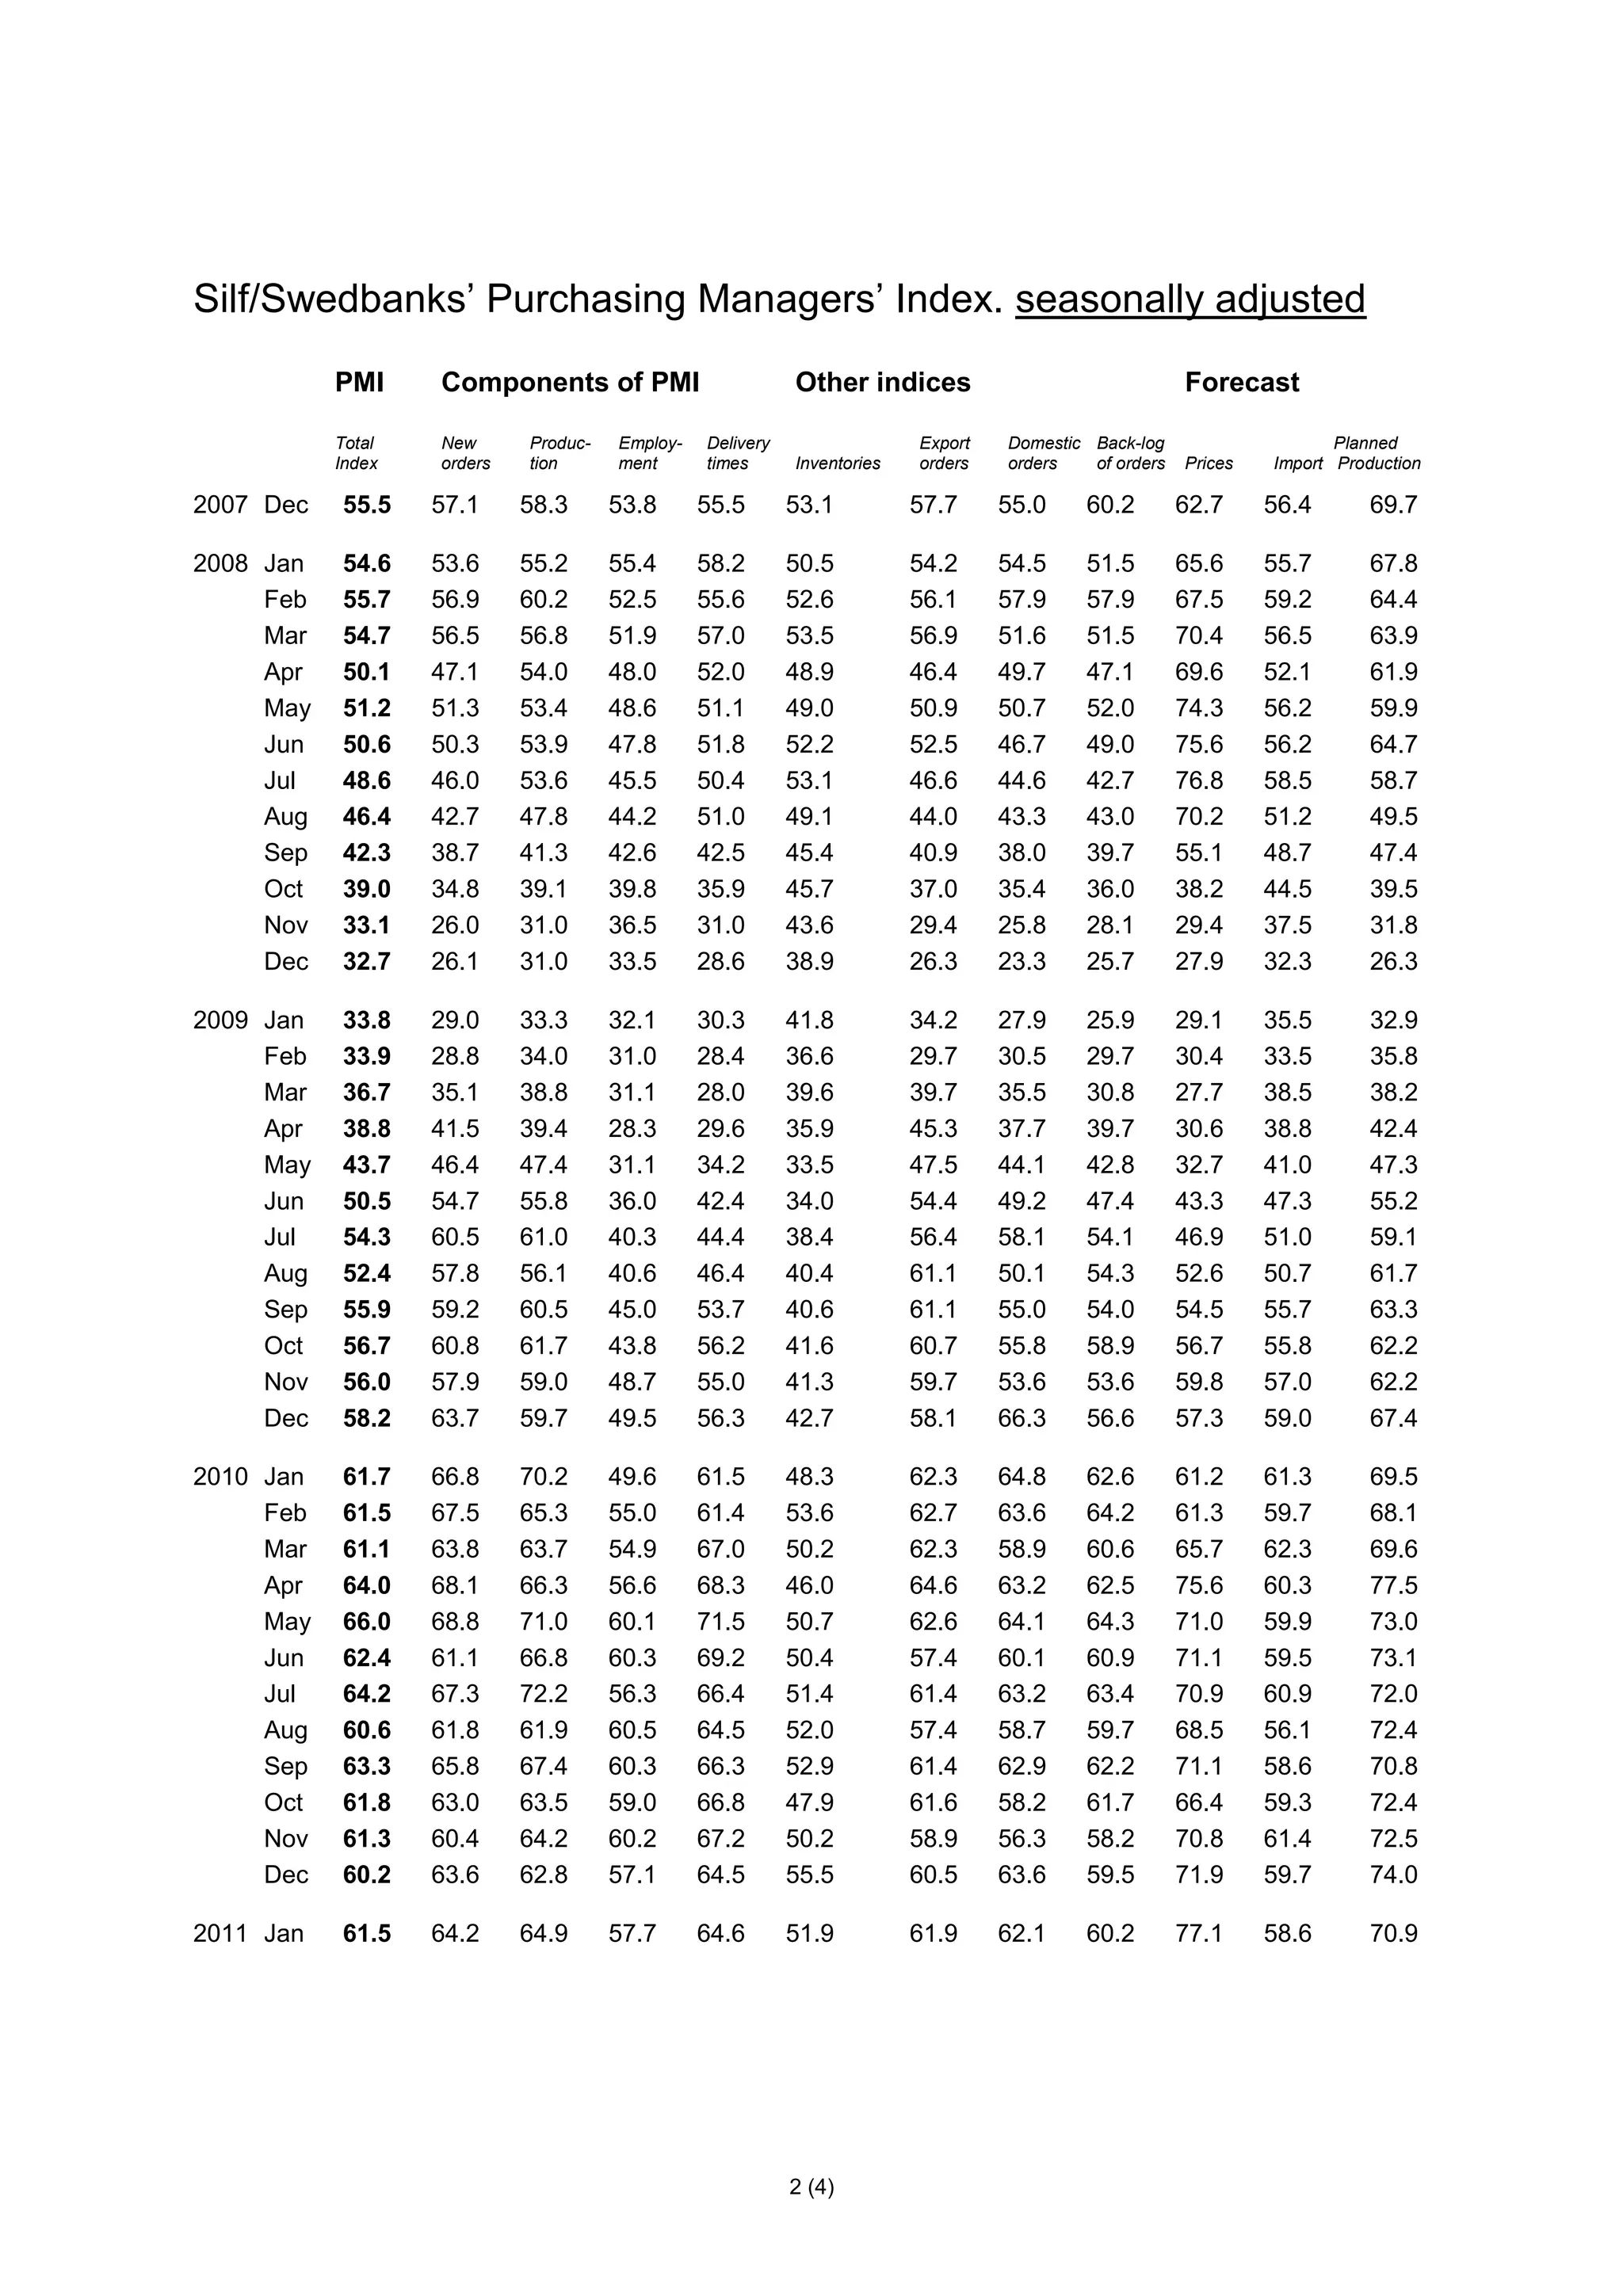
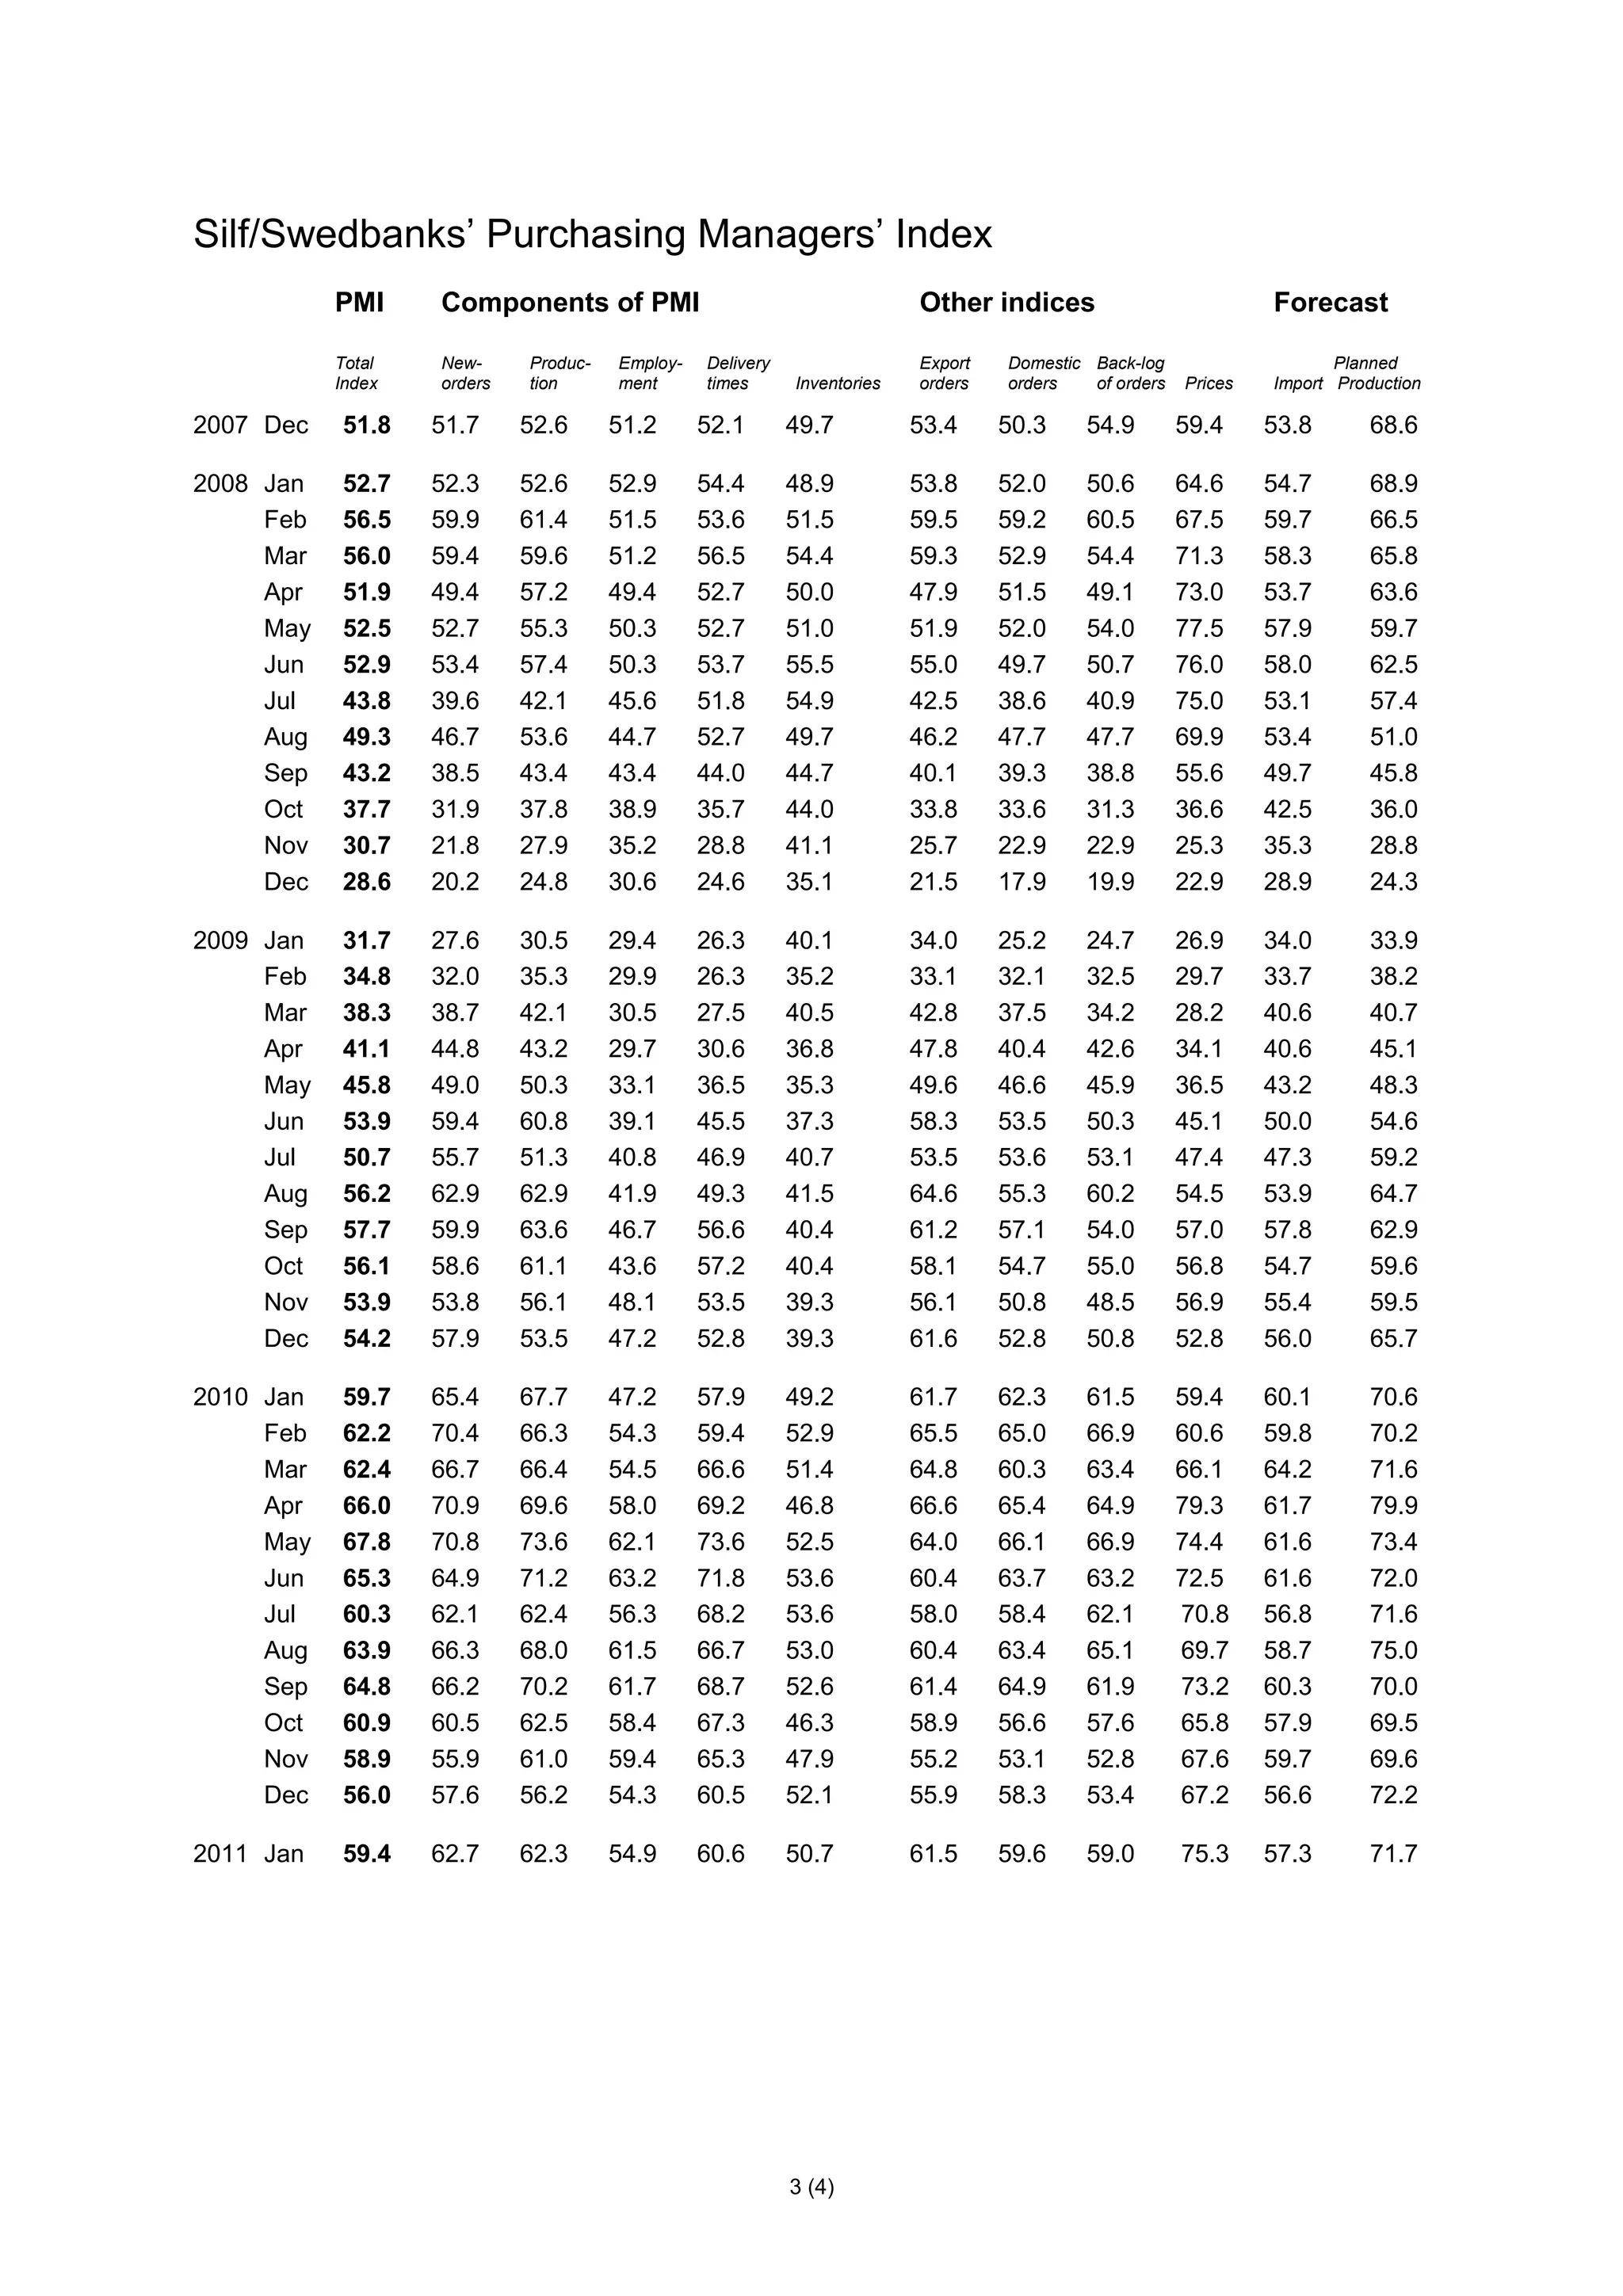

The Purchasing Managers' Index (PMI) for Swedish industry climbed to 61.5 in January 2011, up from 60.2 in December 2010, indicating continued strong growth. The index for production had the largest positive impact on the increase. Suppliers' commodity and intermediate goods prices also rose to their highest level in over four years. While production plans for the next six months remained positive, they were revised slightly downward from December.


